XY Plot
You can use this module only when the first 2 channels are active.
Channel-1 → plotted on X axis
Channel-2 → plotted on Y axis
Features
- Real-time processing
- Fading graphic effect
- Big graph space
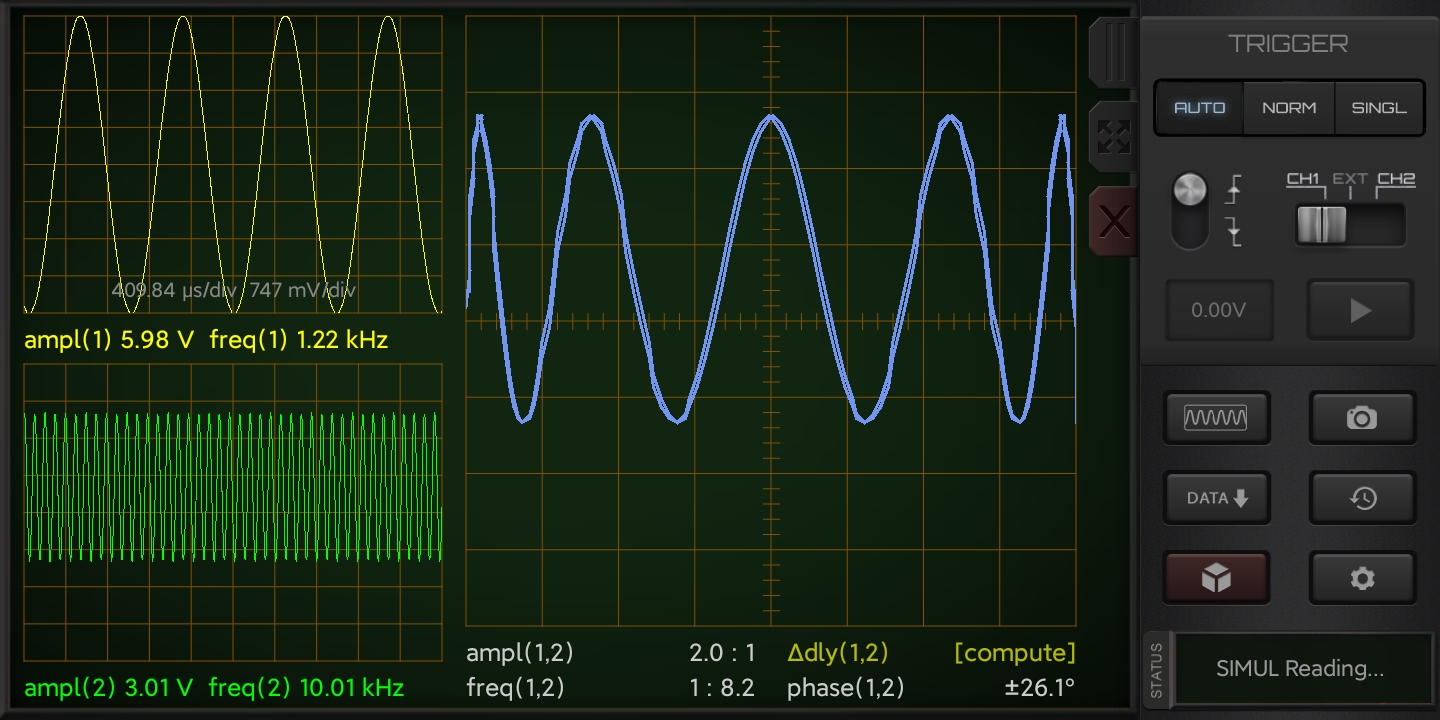
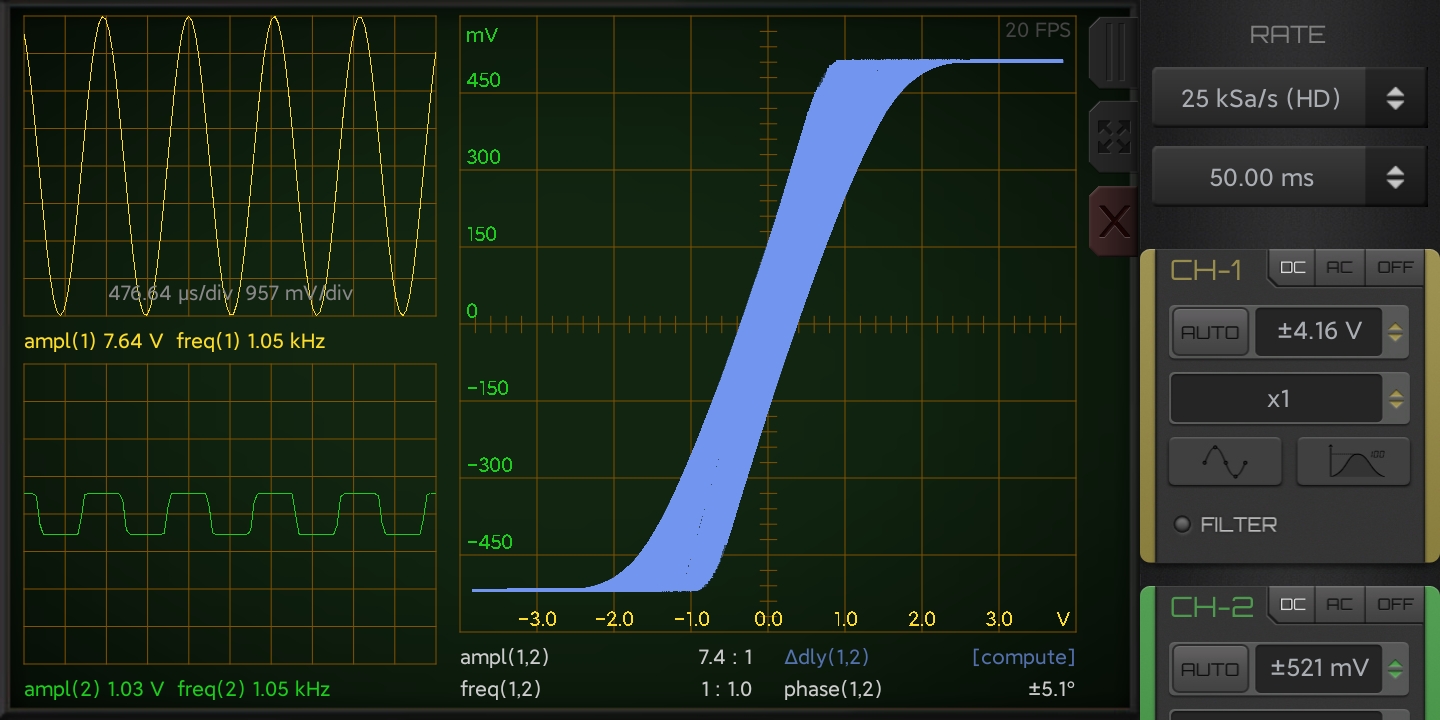
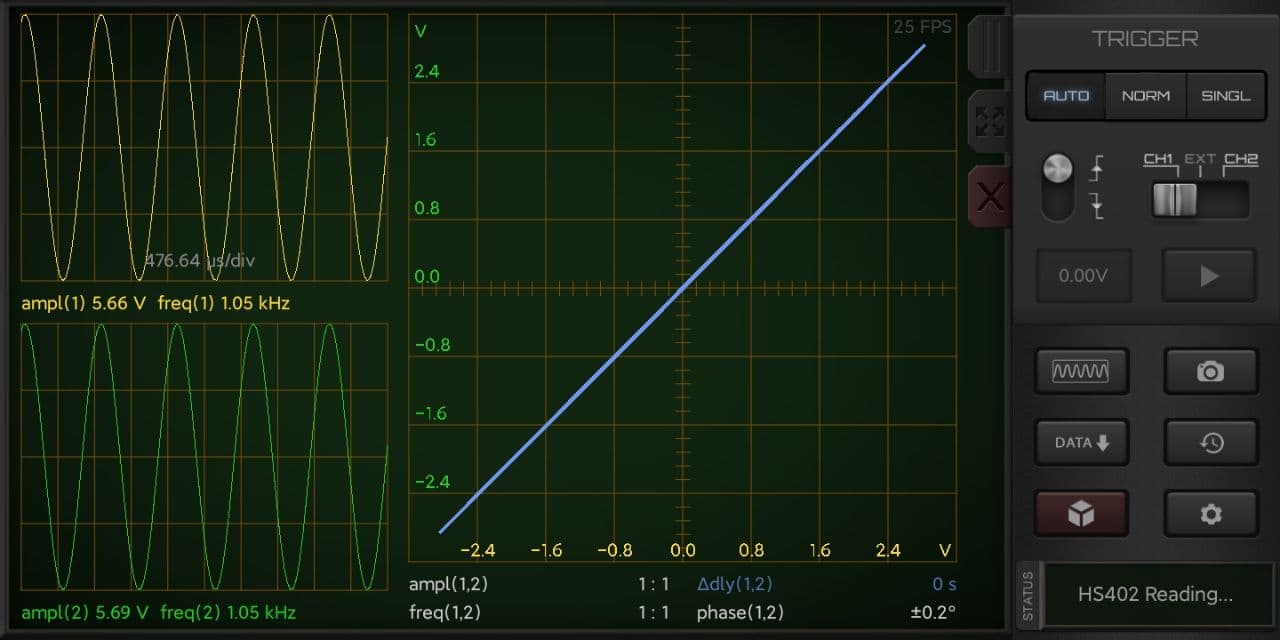
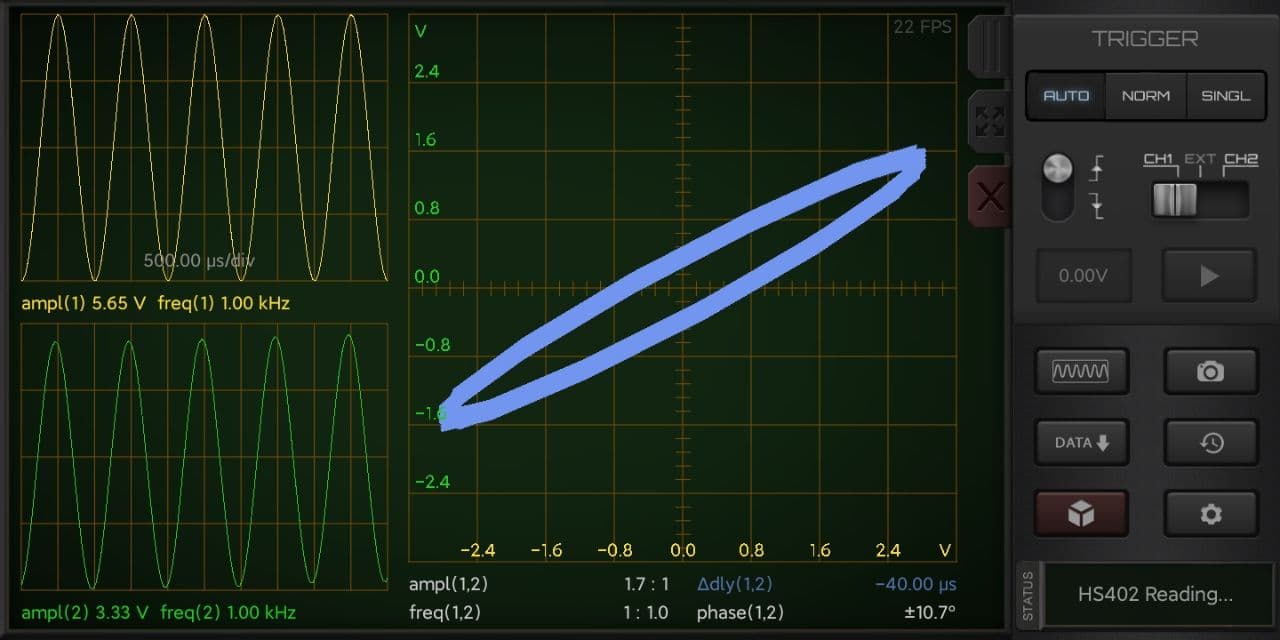
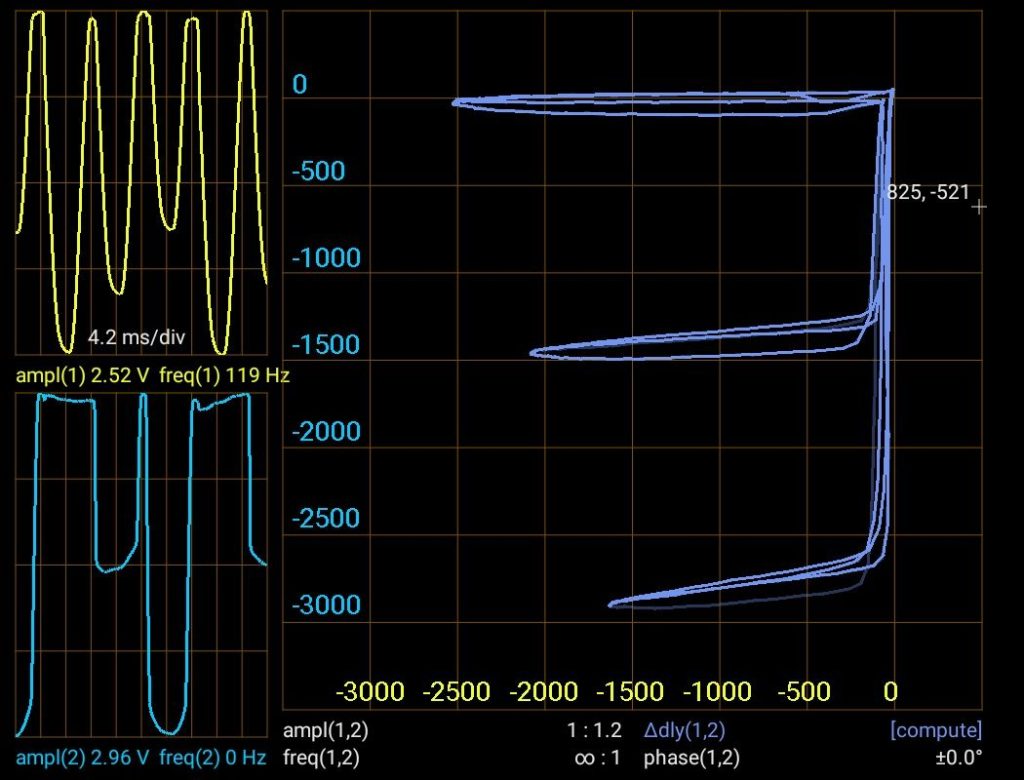
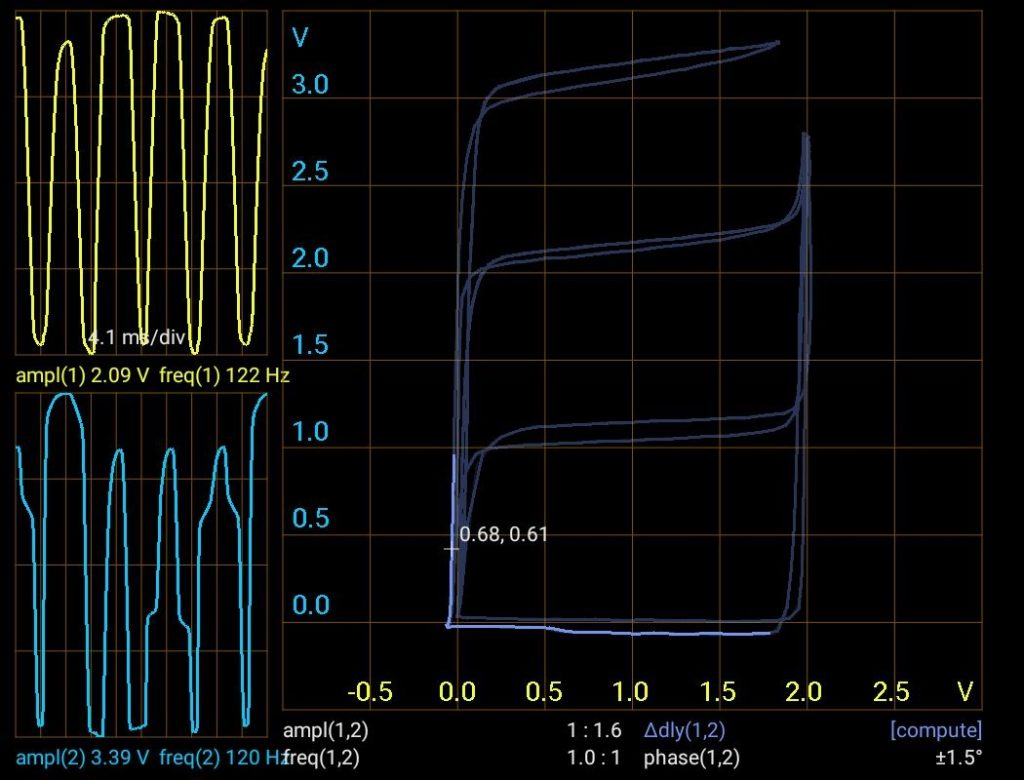
On the left you can see 5 periods of both channel signals with the information about amplitude and frequency.
On the right there is the XY Plot with comparison information of the two signals. The phase shift is calculated with the Lissajous method and it is valid just for Sinusoidal Waveforms with same frequency.
Calculation of Time Delay
If you want to calculate the time delay for an arbitrary signal from 2 points of a circuit under analysis, just press the yellow/blue text and you will see this value obtained from the Cross-Correlation of the two signals.
Invert the Signals
If you want to invert one or both the signals, just Invert it in the Filter panel available for each channel.
Proof of Concept
The following video show the real-time capacity of this module.
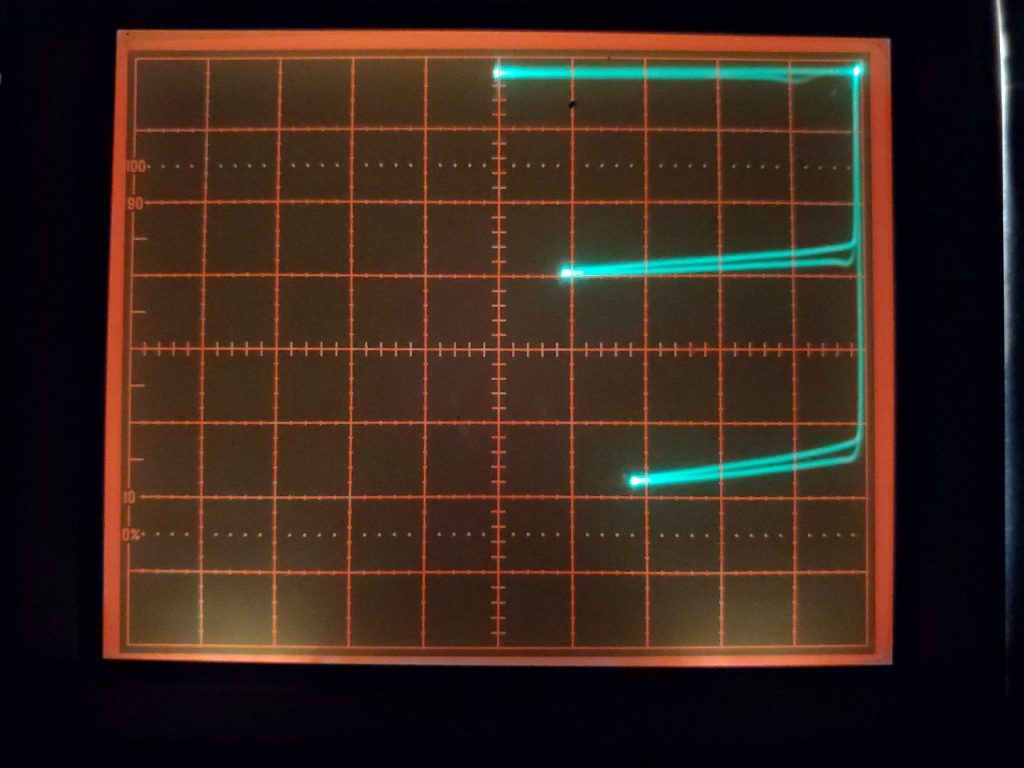
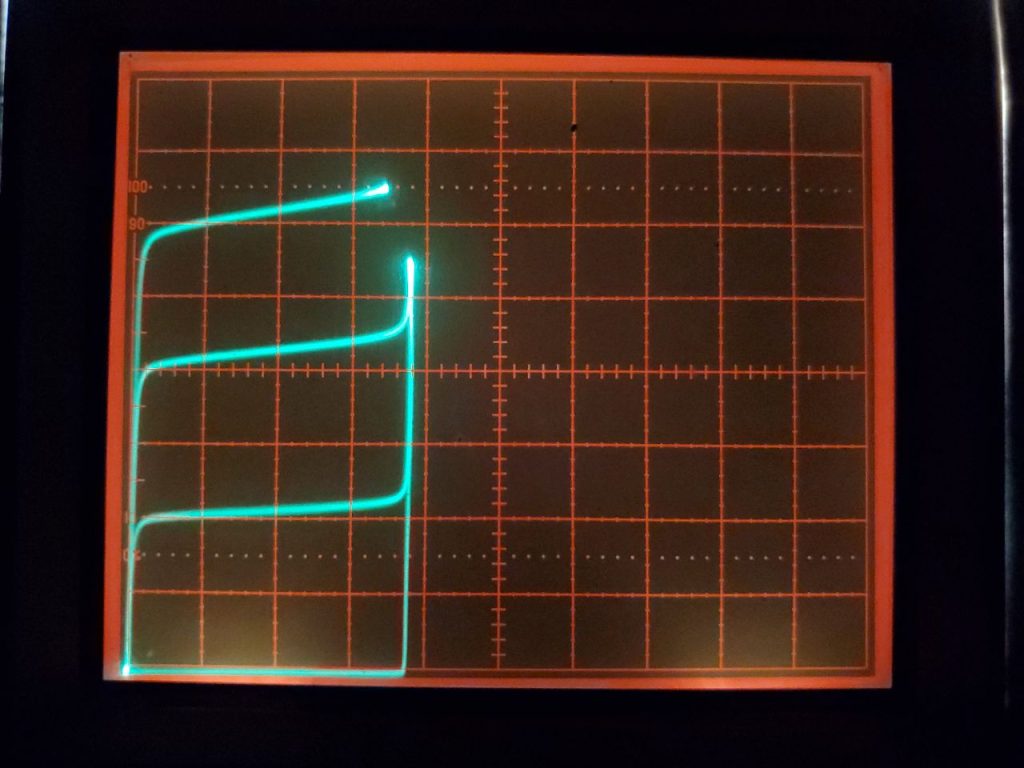
Screenshots
Comparison test between HS-402 and Tektronix-465 oscilloscopes with PNP and NPN transistors.